Description
As you might not know, the meteorological surface synoptic observations data (SYNOP, available here: https://donneespubliques.meteofrance.fr/?fond=produit&id_produit=90&id_rubrique=32) does not take into account sunlight/luminosity.
Sunlight/luminosity data can be interesting to gather for
a diversity of uses (home well-being, photovoltaics production, plants care,...).
For photovoltaics, although the technology is old, I did not manage
to find reliable measurements for cloudy weather.
We find videos of such a measurement, for example this one:
https://www.youtube.com/watch?v=H_Aow78MFmQ&ab_channel=TopeSosanya
that may suggest that solar pannels produce at 50% of their nominal capacity.
My measurement instruments being subject to interferences, I dont really trust my measurements to be reliable, so i thought about producing simple code that other users less subject to interferences could reuse at their convenience.
This tutorial will allow you, with only two commands (after installing operating system and docker), to use your single board computer like a weather station recording sunlight/luminosity every minute in a database and producing a web page where results can be retrieved with date filters options.
the demo is available here:
https://vpn.matangi.dev/lum
Note: dont trust the measurements displayed in the demo above: the ecoterrorist french police doctrine destroys the possibility to do science correctly in france with computers. I do not have the adequate financial and technical means, and I do not want to spend time playing cat and mouse again and again to dodge recurring cyber attacks and shackles.
The logic integrity of the code is good.
If the system changes, or if you are not targetted too much, this could be useful.
Publishing on lowtechlab is a signal to encourage you
to do your own measurements with diy stuff, like a multimeter and an old offline camera to upload on youtube or peertube.
If you read this tutorial and you are not yet an ecoterrorist, you have a superpower: the invisibility cape.
Matériaux
single board comptuer (raspberry or other): approximately 100€
usb key: 10€
luminosity sensor (yoctopuce yoctolight v4): approximately 30€
video: measurement accrediting the hypothesis of a production at 50% of nominal power by cloudy weather (https://www.youtube.com/watch?v=H_Aow78MFmQ)
Outils
Étape 1 - Single board computer installation
Install dietpi
To install, i recommend using dietpi. Dietpi is intersting in particular for it is lightweight, but also for it has a user-friendly menu to install automatically a lot of free software. We can mention among all the free software available to install at startup (https://dietpi.com/dietpi-software.html) home automation apps, interesting to save energy depending on the weather, but also "tor" apps to contribute to the relatively anonymizing network, which can be interesting for ecoterrorist we are.
Select your single board computer (orange pi in this case) and then download
Unzip the downloaded archive.
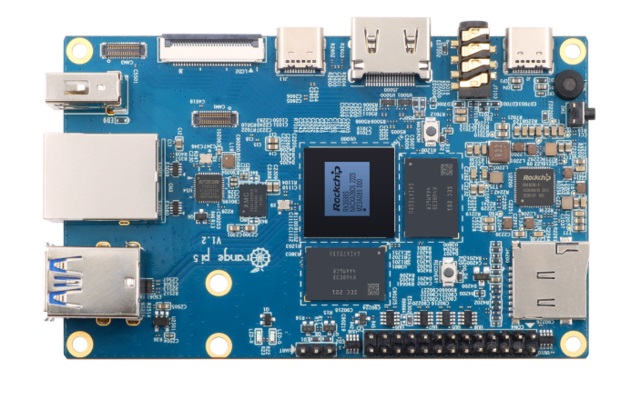
Use balena etcher to create a bootable usb key to install dietpi on your single board computer (orange pi 5 in this case but it works the same with other SBC).
https://etcher.balena.io/#download-etcher
Double click on the downloaded file
Select the downloaded dietpi image, select your usb key, click on flash.
You just have to plug your usb key to the orange pi now and it will boot automatically.
For a raspberry pi, we use a sd card but you can configure the usb boot as well (see here: https://makerhelp.fr/booter-un-raspberry-pi-4-sur-un-disque-dur-ou-un-ssd-en-usb/).
Power on your orangepi/raspberrypi with the usb key plugged.
Follow the dietpi menu at first boot to install dietpi without any other software. It is very easy, it is in english, everything is automated.
You can move in the menus with arrow and tab keyboard keys.
Select with space and validate with enter.
Do not install optional software like nextcloud.
Étape 2 - Plug in the luminosity sensor yoctopuce yoctolight v4
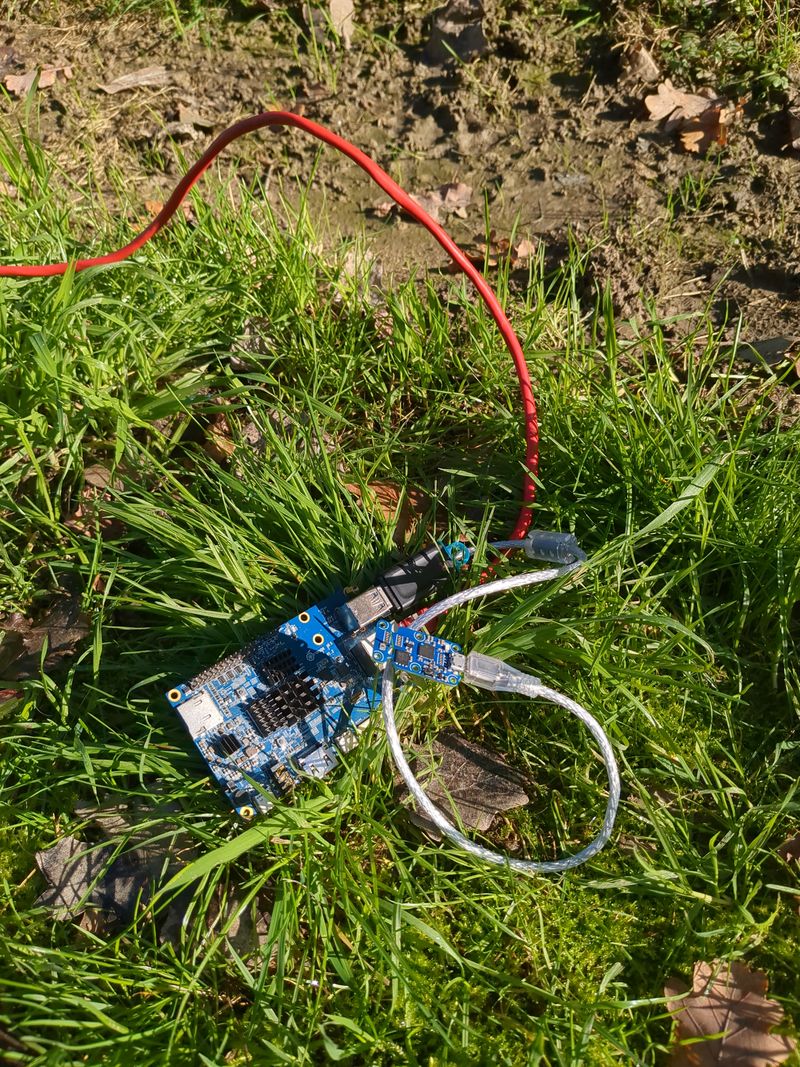
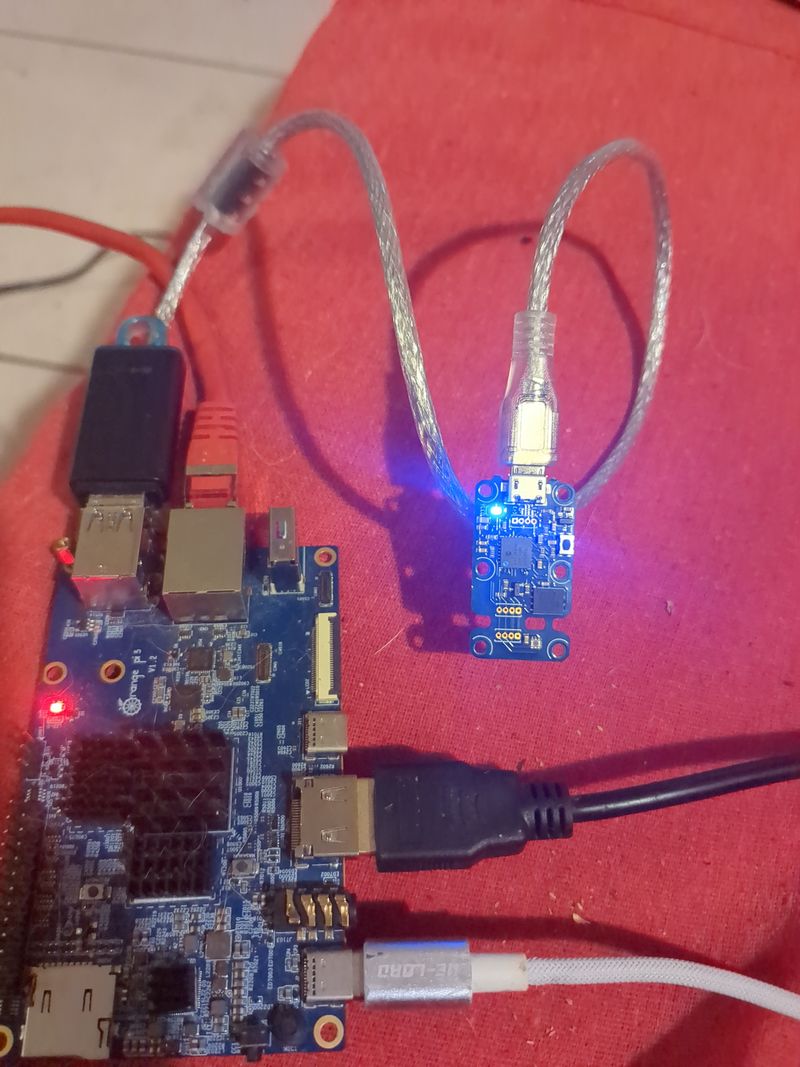
The blue led of the sensor blinks slowly when the sensor is plugged in.
Watch out not to unplug the sensor when measuring, otherwise you will need
to restart the server (or just docker compose down && docker compose up)
Étape 3 - install django server
1.install docker:
type in your terminal:
sudo apt -y update && sudo apt -y upgrade
sudo apt install git lsb-release gnupg2 apt-transport-https ca-certificates curl software-properties-common -y
curl -fsSL https://download.docker.com/linux/debian/gpg
sudo add-apt-repository "deb [arch=$(dpkg --print-architecture)] https://download.docker.com/linux/debian $(lsb_release -cs) stable"
sudo apt update
sudo apt install docker-ce docker-ce-cli containerd.io docker-compose-plugin
sudo usermod -aG docker $USER
newgrp docker
sudo systemctl start docker && sudo systemctl enable docker
2.follow the instructions on the repository https://gitlab.com/aurelpere/lux (free software i coded to use yoctolight more easily):
type in your terminal
git clone https://gitlab.com/aurelpere/lux.git
type in your terminal
cd lux && docker compose up
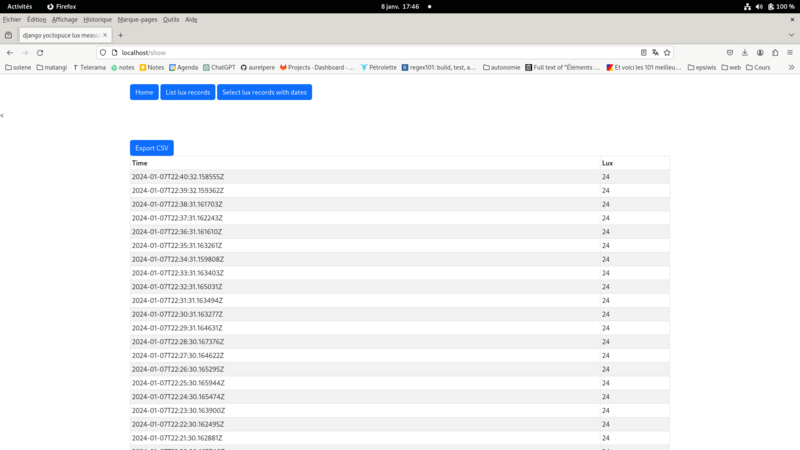
It is ready, your single board computer records the luminosity measurements
in lux every minute and runs a website
available on port 4000 that permits to display database recorded measurements
and select measurements based on
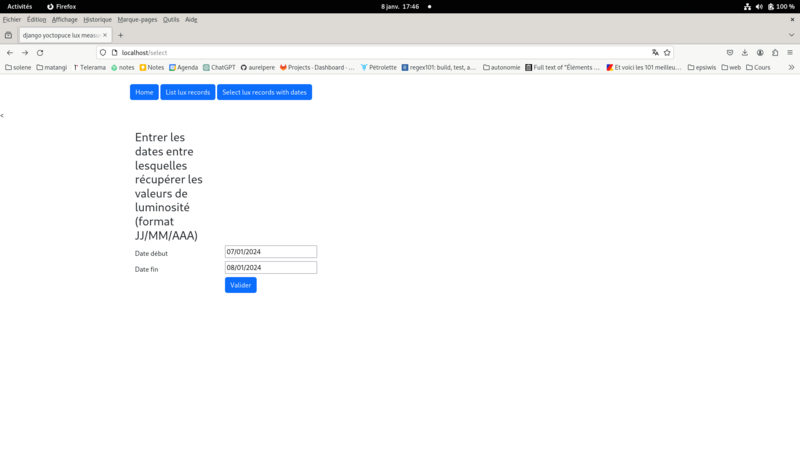
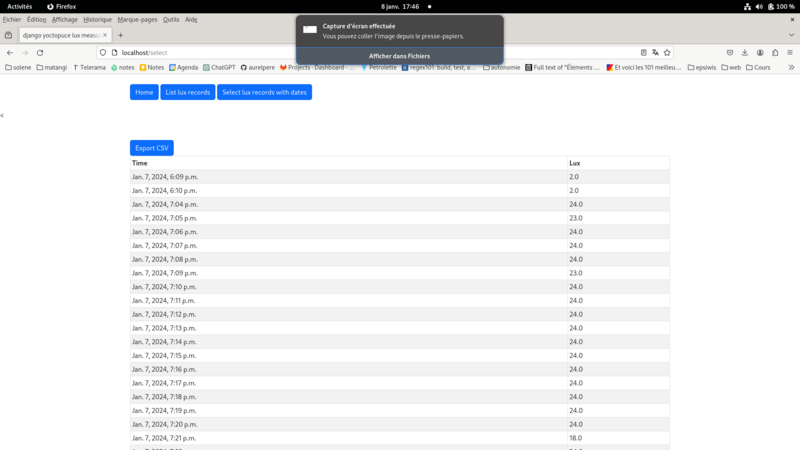
dates filter (with possible excel export).
To make the website available to other computers, see
stages 6 to 11 of this tutorial:
Serveur orangepi-raspberry nextcloud en photovoltaïque autonome
The sever is available at http://ip_address:4000 locally and http://public_ip_address on the internet
This tutorial will be updated with amperage and voltage yoctopuce sensors when i have time, motivation and budget :)
Notice that if you prefer to use sunlight stats of the jrc model,
you can use my other tutorial on offgrid photovoltaic sizing here: Dimensionner une installation photovoltaïque autonome
Published

 Français
 English
 Deutsch
 Español
 Italiano
 Português